- 2018-05-27
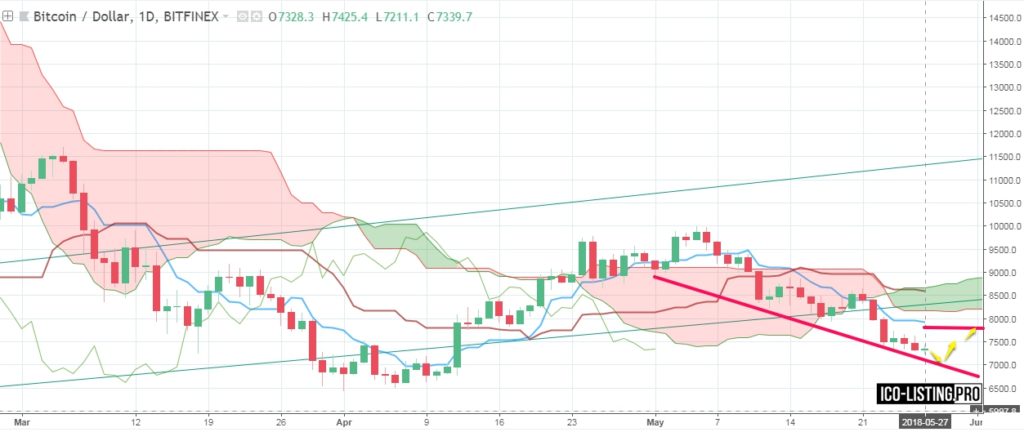
Bitcoin (BTC/USD) is finishing its trading week near 7340.
BTC broke out of Ichimoku Cloud the past week and now it’s traded below it which shows the beginning of downtrend.
We can see a forming star so there will probably be going up this week. Signal lines of MACD are going down so it won’t be an intense uptrend but more likely a sideways move this week.
We can already define a support level of downdtrend and now there ahould be a new short-term not intense The Ichimoku lines and MACD lines are going in parallel and show no signs of a turn.
So it is likely that BTC will go to 7150/7100 and then go up to the resistance level this week. The rise will be likely not intense. The price can go up to approx. 7700/7750 till the end of the week.

It is very risky to buy BTC now.
Short-term trading is possible though it’s very risky and highly not recommended because we have downtrend and now the week rise of price can last only about 1-2 weeks and the fall after it can be rather intense.
If BTC breaks the Conversion line of Ichimoku and opens above it it’ll be a signal to buy but only for short-time trading.
Make sure you don’t forget to put stop-losses below the Conversion line.
*predictions are made on the basis of several indicators. Only 1 indicator is shown on the screenshots for the purpose of not overloading the chart with technical details and indicators’ lines.

