- 2017-10-22
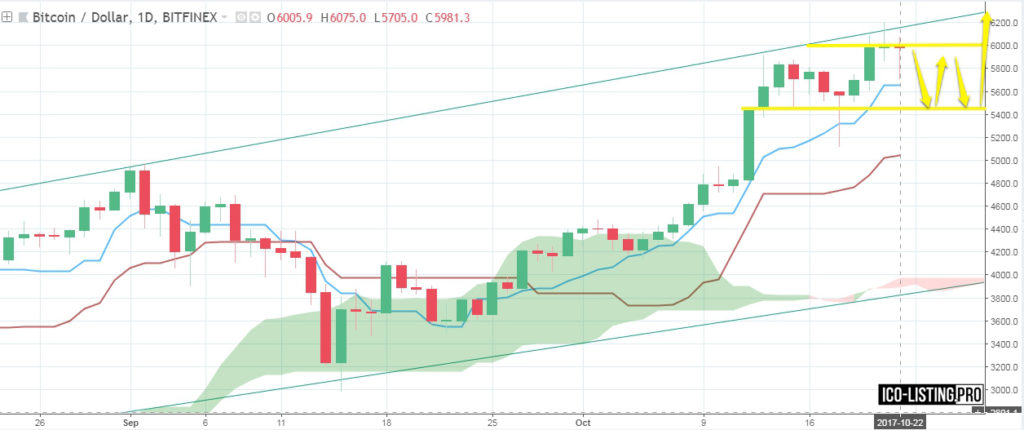
Bitcoin (BTC/USD) is finishing its trading week near 5990.
BTC tried 6100 even came to 6200 on 2017/10/21 but was not strong enough to stay there and went below resistance level at 6100 again. It is still moving near the resistance line of uptrending corridor but the last week shows sideways trend.
There is possibility of the price breaking resistance level at 6170 and going up to 6300. This will mean strengthening of bullish trend. It can also go down to 5110 and try it.
It is more likely that Bitcoin will try to break through the conversion line of Ichimoku and go down to 5450. Then it will go back and continue being traded above the line.
It will go up and try to break 6000 and then go up as high as 6300 (the resistance line of uptrending corridor) again. This week the price will reach below the conversion line of Ichimoku, go above it and go to the resistance level of uptrending corridor.*

If BTC is already bought there should be put a stop-loss above Base Line of Ichimoku (at 5250 will be rather safe for now).
If BTC breaks the conversion line at 5650 and opens above it again it’ll be a signal to buy. The price is very likely to come to resistance level at 6000 and to go down to the conversion line again for another turn. BTC will probably reach about 6100 and try 6300 level again at the end of this week.
*predictions are made on the basis of several indicators. Only 1 indicator is shown on the screenshots for the purpose of not overloading the chart with technical details and indicators’ lines.

