- 2017-11-19
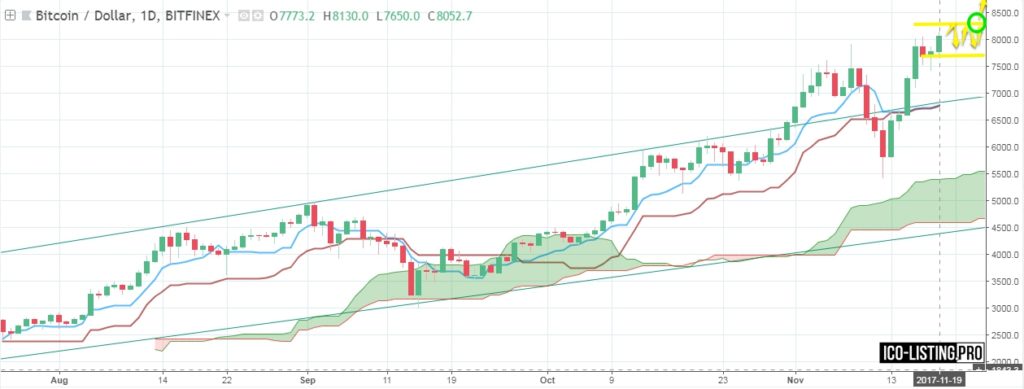
Bitcoin (BTC/USD) is finishing its trading week near 8050.
BTC went above indicator’s lines and broke the resistance line again this week.
There is possibility of the price going down to try the support line of new uptrending corridor at 6900-7000.
We see that indicator’s lines are moving on the same level and direction (they practically merged). So it shows the possible sideways trend (most likely short-term). It also looks like there is the beginning of a Flag now.
It’s most likely that price will go sideways for 3-5 days. After it there will be a price jump for about 1000. So if the price breaks the resistance line at 8400 there will be strong possibility of BTC going up up to 9300 till the end of the week.*

If BTC is already bought there should be put a stop-loss below the higher level of the old uptrending corridor at 6850.
If BTC goes up and breaks the resistance line at 8400 that will be a signal to buy. This will mean the breaking of the flag and returning to uptrend again.
*predictions are made on the basis of several indicators. Only 1 indicator is shown on the screenshots for the purpose of not overloading the chart with technical details and indicators’ lines.

