- 2018-04-15
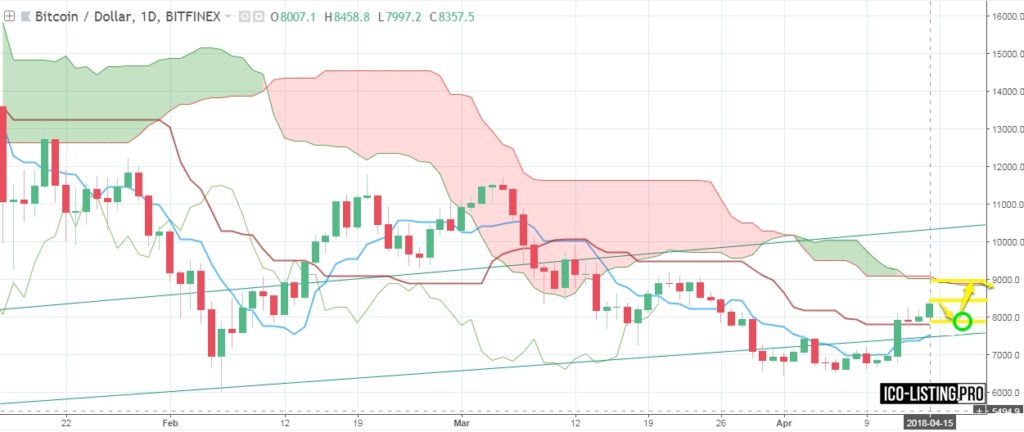
Bitcoin (BTC/USD) is finishing its trading week near 8257.
BTC broke the resistance line of previously formed narrowing downtrend corridor (Triangle) and made a quick rise from 6800 to the present price.
Additional indicator’s (MACD) lines are going up and Span of Ichomoku is going up too. So there will be continuation of bullish move this week.
It is probable that there will be some retreat down of the price for 1-2 day and then it’ll go up again.
BTC is already traded above indicators lines so it will go up and try to break through the Ichimoku Cloud at about 8900/9000. Though it’s possible that BTC won’t break through the Cloud this week.*

If BTC was previously bought there should be put a stop-loss below indicators lines because uptrend is not yet completely formed and the price can go down.
It is a proper time to buy now. MACD formed a signal to buy the past week. The additional signal to buy can be made also by the Converson Line crossing The Base line from below and it is moving towards crossing now.
BTC can quickly go up to 8900/9000 this week.
*predictions are made on the basis of several indicators. Only 1 indicator is shown on the screenshots for the purpose of not overloading the chart with technical details and indicators’ lines.

