- 2018-06-10
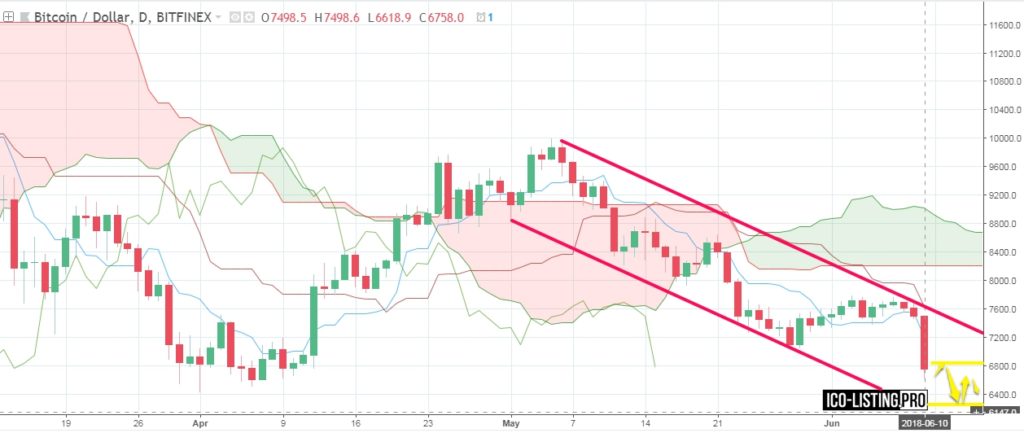
Bitcoin (BTC/USD) is finishing its trading week near 6758.
BTC broke down through the Conversion line of Ichimoku today and now it’s still going downward. We can see there was sideways move during the week.
Additional indicator (Stoch RSI) showed strong signal to sell yesterday and now its signal lines are going down and out of the Overbought zone. It means that BTC price fall can go on for some days.
There is possibility that BTC will go up and try to break through the Conversion line again though it’s very light probability.
It is more likely that it will have some retreat to 6800/6850 and then go further down for a 1-3 days. As the indicators lines show the reduction of intensity of the move there will possible be a short retreat up again and then sideways move this week.
So it is likely that BTC will go between 6200/6150 and 6800/6850 during the week and there is very high possibility of its intense going down at the end of the week.

It is very risky to buy BTC now.
Short-term trading is possible though it’s very risky and highly not recommended because we have downtrend and this week’s short rises and falls (sideways move) can likely end in about 1-2 weeks and the fall after it can be rather intense.
If Stoch RSI’s lines enter the Oversold zone, line K crosses line D from below and they both go up this will be very signal to buy BTC. It can go up in the direction of the resistance line of downtrending corridor. BUT it’s to be noted that this strategy is suitable for the current flat (sideways move) and must be used very catiously because the downtrend can go on soon.
*predictions are made on the basis of several indicators. Only 1 indicator is shown on the screenshots for the purpose of not overloading the chart with technical details and indicators’ lines.

