- 2017-10-08
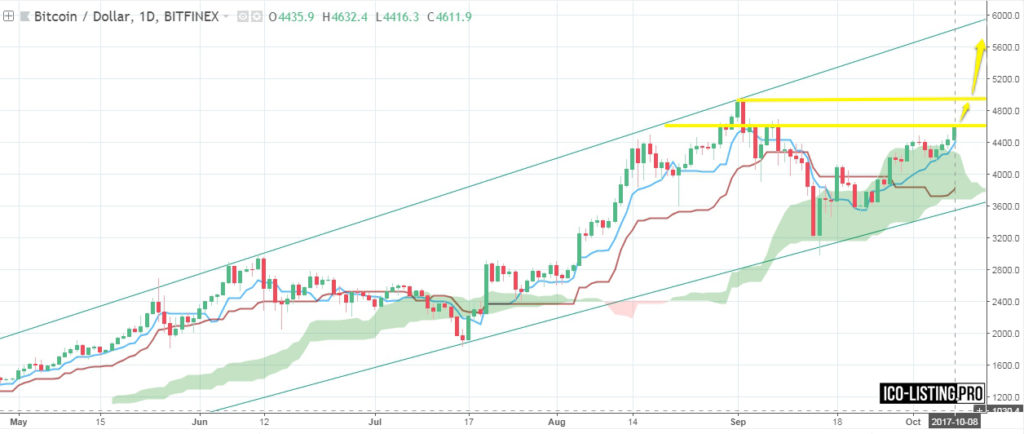
Bitcoin is finishing its trading week near 4610.
It is traded above Ichimoku Cloud for the past 2 days and it shows the beginning of uptrend.
There is possibility of the price going down from resistance level at 4620 to 4250 to test the upper side of Ichimoku Cloud and its Conversion line. If it breaks them this will mean the return to sideways trend.
But it is more likely that Bitcoin will go on being traded above the conversion line of Ichimoku, will break resistance level at 4620 and go up to try resistance level at 4910. If it breaks 4910 too it’ll go to the resistance level of uptrending corridor. It’ll try the level but probably there will be some recoil.*

If BTC is already bought there should be put a stop-loss below the lower side of Ichimoku Cloud or the support level of uptrending corridor.
If BTC breaks resistance level at 4620 and opens above this level it’ll be a signal to buy. The price is very likely to break resistance level at 4910 and go up as far as 5850 (resistance level of uptrending corridor) till the end of this week.
*predictions are made on the basis of several indicators. Only 1 indicator is shown on the screenshots for the purpose of not overloading the chart with technical details and indicators’ lines.

