- 2018-06-03
Bitcoin (BTC/USD) is finishing its trading week near 7718.
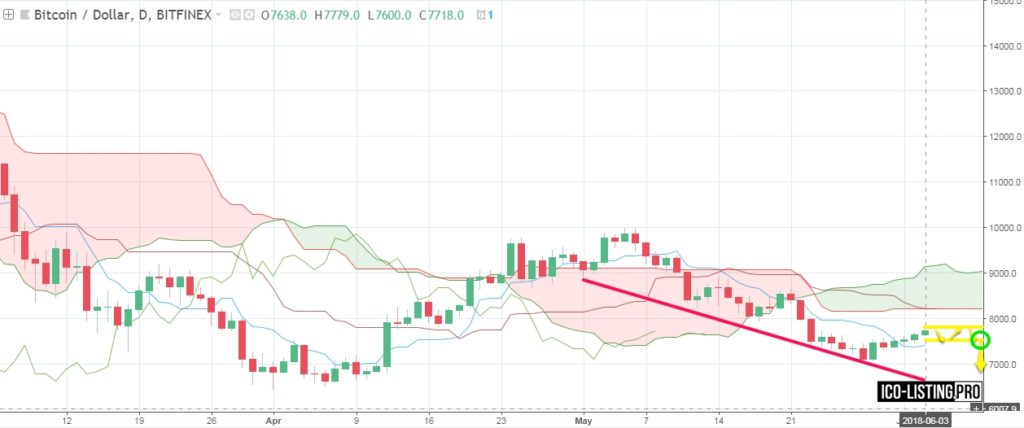
BTC broke up through the Conversion line of Ichimoku the past week and now it’s traded between it and the base line. We can see there was mostly light bullish move during the week (most likely it’s short-term one).
Today BTC tried to make a bullish move too. Additional indicator (Stoch RSI) shows that BTC is entering Overbought zone. It means that the strength of bulls is about to end this week.
There is possibility that BTC will go up and try to break through the Base line and to enter the Cloud.
But it is more likely that it will continue being traded above the Conversion line and try to break down through it several times. If the price shows the highest values of being overbought on RSI and breaks through the Conversion line it can begin intense falling (bearish move).
So it is likely that BTC will go between 7700/7750 and 7500/7450 during the week and there is very high possibility of its intense going down at the end of the week.

It is very risky to buy BTC now.
Short-term trading is possible though it’s very risky and highly not recommended because we have downtrend and this week’s rise most likely will end in about 1-2 weeks and the fall after it can be rather intense.
If Stoch RSI’s lines enter the Overbought zone, line K crosses line D from above and they both go down this will be very strong signal to sell BTC. It can go down in the direction of the support line of downtrending corridor very intensely and reach approx.6700/6650 till the end of the week.
*predictions are made on the basis of several indicators. Only 1 indicator is shown on the screenshots for the purpose of not overloading the chart with technical details and indicators’ lines.

