- 2018-10-01
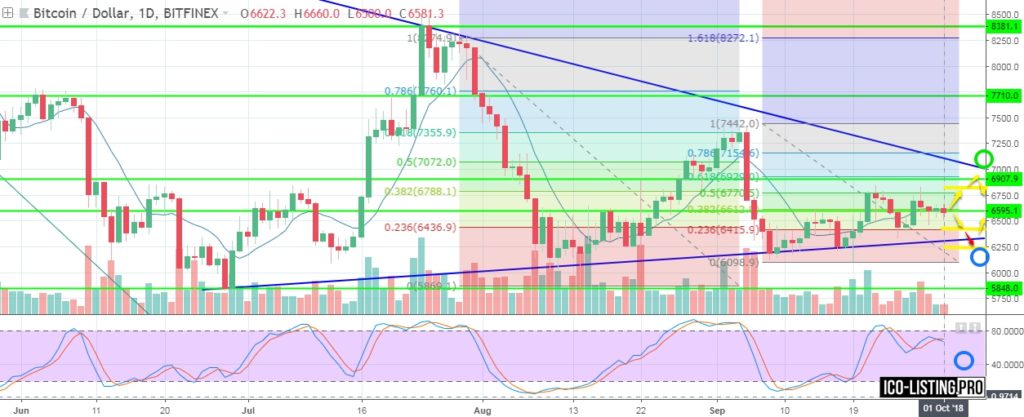
Bitcoin (BTC/USD) finished its previous trading week at 6622.
BTC was traded practically on the level of MA line for the past week.
Today BTC tries to go down but the movement is very weak.
The price reached 6400 the previous week but couldn’t break through that level and retreated lightly up. And today it tried 6500 level but hasn’t broken it yet. So the Bears are rather weak now.
Additional indicator’s lines (Stoch RSI) went out of the Overbought zone. It was moving horizontally and doesn’t show any signs of upwards or downwards movement today.
The price tried Support level at 6400 and Resistance level at 6800 but broke neither of them. So BTC can go and try them this week too.
The price movement has had very low intensity for the last 4 days.

On larger timescale (week) BTC seemed to begin a downtrend. There was new maximum (lower than previous) but BTC hasn’t drawn new minimum yet. So it looked that we had Triangle.
Now the price broke lightly down out of it but now it returned into the Triangle.
If the price breaks out of the Triangle we can expect rather intense fall or rise (depending on the direction of breaking movement).
BTC was traded on the level of MA line for the last 3 days. And today it is still there but it makes some weak moves in the direction of crossing the MA downwards. If BTC crosses the MA down, opens below it and continue to go down it’ll mean the signal of bearish move. Now we see only distinct Flat (sideways move).
Oscillator’s indicators went out of the Overbought zone. But today they don’t look like trying to go down. If they continue to go down this can mean BTC’s downwards movement (but the intensity of the movement wil be rather low).
We expect that BTC can go down and try 6400 level again (can even come to 6250/6200).
But it can also alternatively go up to try 6750/6800 and 6900 levels again.
BTC can go both the of the variants during 1-2 weeks!
Trading is possible. Still we have the distinct Flat now. And this is very dangerous situation. BTC comes to the edge of the Traingle.
If the price breaks down out of the Triangle the the fall can be very quick and intense (up to 2000 points).
If BTC breaks up out of the Triangle it can rise very quickly and intensely too.
Don’t forget to put proper stop-losses according to your risk management!
NOTE. There is some sort of unpredictability of the market now. Indicators’ signals miss the real movement of price sometimes. The volumes of bought/sold BTC don’t correlate with the price’s moving. Oscillator’s indicators can be in Overbought/Oversold zone for a week or even more.
There can often be some plot to such a situation. If we notice such unusual (unpredictable) activity we’ll give its analysis and conclusions in our extra posts.
*predictions are made on the basis of several indicators. Only 1-2 indicators are shown on the screenshots for the purpose of not overloading the chart’s pics with technical details and indicators’ lines.

